
Usòrò:2011- Renewable energy capacity - International Energy Agency.svg

Size of this PNG preview of this SVG file: 800 × 450 piksels. Ndị ọzọ mkpebi:320 × 180 piksels | 640 × 360 piksels | 1,024 × 576 piksels | 1,280 × 720 piksels | 2,560 × 1,440 piksels | 1,200 × 675 piksels.
Failụ si na nke mbu (usòrò SVG, nà áhà pixel 1,200 × 675, ívụ usòrò: 4 KB)
Mmẹkụwátá
| Nkówá |
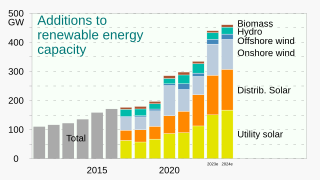
English: Bar chart (column graph) of the number of gigawatts of w:renewable energy capacity (2011- ), as reported by the w:International Energy Agency.
|
||
| Ǹgụ́ụ̀bọ̀chị̀ | |||
| Mkpọlọ́gwụ̀ | Orü ọnwé | ||
| Odé ákwụ́kwọ́ | RCraig09 | ||
| Nke ya ozor |
|


Nkwényé
I, the copyright holder of this work, hereby publish it under the following license:
This file is licensed under the Creative Commons Attribution-Share Alike 4.0 International license.
- I wepulara nóru:
- i nye – ikọpị,ikekasi na izịpụ ọru a
- i dowaria – igbanwee ọrụ a
- Ọ ga bụ na ọnọdụ ndi a:
- í-kpó-áhà – Ị ga-enyerịrị ugo kwesịrị ekwesị, nye njikọ na ikikere ahụ, ma gosikwa ma emere mgbanwe. Ị nwere ike ime ya n'ụzọ ezi uche ọ bụla, mana ọ bụghị n'ụzọ ọ bụla na-egosi na onye nyere ikikere kwadoro gị maọbụ ojiji gị.
- gbásàa kà – Ọ bụrụ na ị tụgharịgharịa, gbanwee, ma ọ bụ wulite n'elu ihe ahụ, ị ga-ekesa ndenye gị n'okpuru otu ma ọ bụ ikike dakọtara dị ka nke mbụ.
Ịta nke usòrò
Bìri èhì/ogè k'ị hụ òtù ụ̀fa dị̀ m̀gbè ahụ̀.
| Èhì/Ogè | Mbọ-aka | Ógólógó na asaá | Òjìème | Nkwute | |
|---|---|---|---|---|---|
| dị ùgbu â | 10:15, 29 Septemba 2023 | | 1,200 × 675 (4 KB) | Jirka Dl | Reverted to version as of 21:33, 25 August 2023 (UTC) - translation will be in separate file |
| 08:00, 6 Septemba 2023 |  | 1,200 × 675 (6 KB) | Jirka Dl | File uploaded using svgtranslate tool (https://svgtranslate.toolforge.org/). Added translation for cs. | |
| 21:33, 25 Ọgọọst 2023 |  | 1,200 × 675 (4 KB) | RCraig09 | Version 5: update to include data, and projected data, for 2024 | |
| 20:17, 15 Septemba 2022 |  | 1,100 × 700 (3 KB) | RCraig09 | Version 4: update with data through 2021 | |
| 20:01, 13 Mee 2021 |  | 1,063 × 750 (3 KB) | RCraig09 | Version 3: reversed positions of Solar and Wind since Wind showed the greatest increase from 2019 to 2020. . . . Made colors more subdued. | |
| 01:56, 12 Mee 2021 |  | 1,063 × 750 (3 KB) | RCraig09 | Version 2: Breaking down 2019 and 2020 components . . . Changing title to be more precise | |
| 22:10, 11 Mee 2021 |  | 1,000 × 750 (2 KB) | RCraig09 | Uploaded own work with UploadWizard |
Ojiji faịlụ
Ihe ndị na-eso ihe eji Ihu akwụkwọ eme na faịlụ a:
Ejiji failụ zụrụ ọha
Wikis ndi a edeputara na eji kwa failụ a:
- Ihe eji na bn.wikipedia.org
- Ihe eji na cs.wikipedia.org
- Ihe eji na en.wikipedia.org
- Ihe eji na ko.wikipedia.org
- Ihe eji na no.wikipedia.org
- Ihe eji na uz.wikipedia.org
- Ihe eji na zu.wikipedia.org