
Usòrò:Major cities threatened by sea level rise.png
Failụ si na nke mbu (1,425 × 625 pixel, ívù akwukwo orunótu: 29 KB, MIME nke: image/png)
Mmẹkụwátá
| Nkówá |
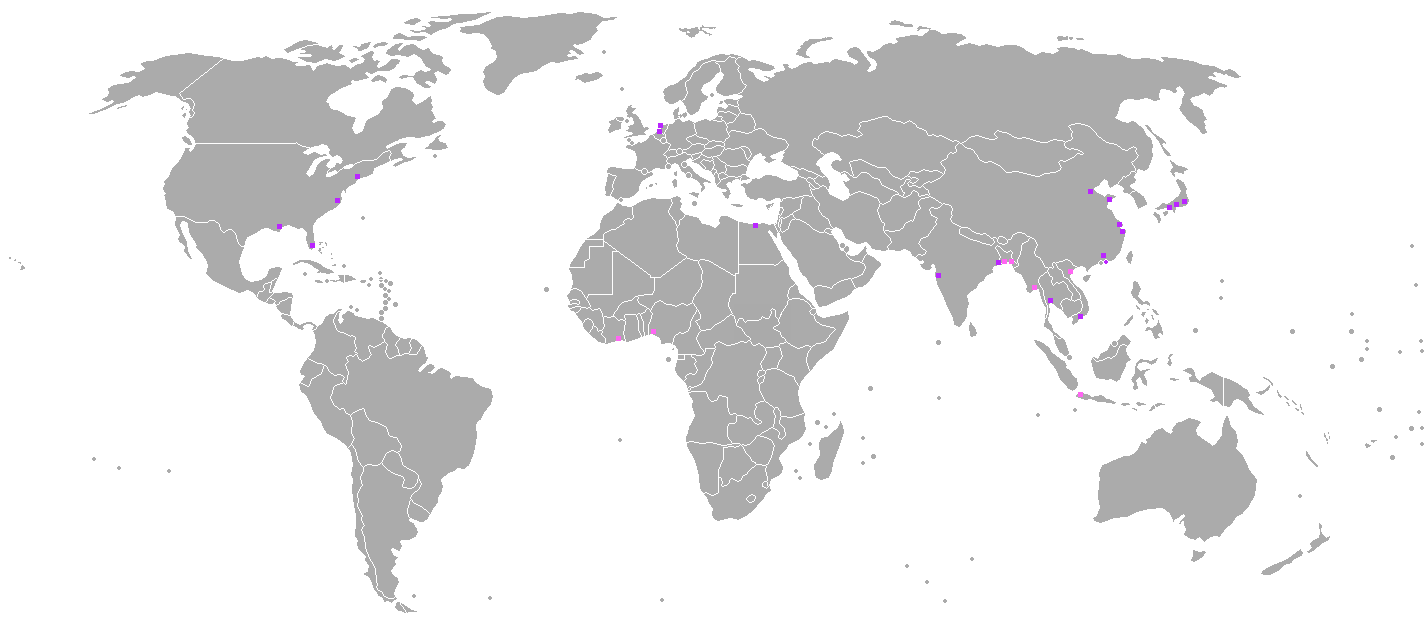
English: Map showing the major cities (in terms of assets and population) that are under threat by the rising sea level. The cities indicated are under threat of even a small sea level rise (of 1.6 foot/49 cm) compared to the level in 2010). Even moderate projections indicate that such a rise will have occured by 2060[1][2]
The map was based on data of a 2007 OECD report[3][4] The report also stated that the total value of the assets exposed in 2005 across all cities is about US$3,000 billion. The top 20 cities in the world in terms of assets exposed to coastal flooding was marked in purple; additional cities that are in the top 20 in terms of population exposed to coastal flooding were marked in pink (there are only 27 cities on the whole map since these cities that have the largest amount of assets exposed to it also have the most people exposed to it). The list of the top 20 cities exposed to coastal flooding is:
The list of 7 additional cities that are in the top 20 most-populous cities exposed to coastal flooding is:
|
| Ǹgụ́ụ̀bọ̀chị̀ | |
| Mkpọlọ́gwụ̀ | Orü ọnwé |
| Odé ákwụ́kwọ́ | Genetics4good |
Nkwényé
- I wepulara nóru:
- i nye – ikọpị,ikekasi na izịpụ ọru a
- i dowaria – igbanwee ọrụ a
- Ọ ga bụ na ọnọdụ ndi a:
- í-kpó-áhà – Ị ga-enyerịrị ugo kwesịrị ekwesị, nye njikọ na ikikere ahụ, ma gosikwa ma emere mgbanwe. Ị nwere ike ime ya n'ụzọ ezi uche ọ bụla, mana ọ bụghị n'ụzọ ọ bụla na-egosi na onye nyere ikikere kwadoro gị maọbụ ojiji gị.
- gbásàa kà – Ọ bụrụ na ị tụgharịgharịa, gbanwee, ma ọ bụ wulite n'elu ihe ahụ, ị ga-ekesa ndenye gị n'okpuru otu ma ọ bụ ikike dakọtara dị ka nke mbụ.
- ↑ File:Projections of global mean sea level rise by Parris et al. (2012).png
- ↑ Sea level rise chart
- ↑ 2007 OECD report
- ↑ OECD report, shortened version
.png)
Ịta nke usòrò
Bìri èhì/ogè k'ị hụ òtù ụ̀fa dị̀ m̀gbè ahụ̀.
| Èhì/Ogè | Mbọ-aka | Ógólógó na asaá | Òjìème | Nkwute | |
|---|---|---|---|---|---|
| dị ùgbu â | 23:31, 10 Jenụwarị 2016 | | 1,425 × 625 (29 KB) | Magog the Ogre | Reverted to version as of 12:52, 2 November 2013 (UTC) |
| 12:52, 2 Novemba 2013 |  | 1,425 × 625 (29 KB) | Genetics4good | User created page with UploadWizard |
Ojiji faịlụ
Ihe ndị na-eso ihe eji Ihu akwụkwọ eme na faịlụ a:
Ejiji failụ zụrụ ọha
Wikis ndi a edeputara na eji kwa failụ a:
- Ihe eji na en.wikipedia.org
- Ihe eji na en.wikiquote.org
- Ihe eji na es.wikipedia.org
- Ihe eji na mk.wikipedia.org
- Ihe eji na zh.wikipedia.org